

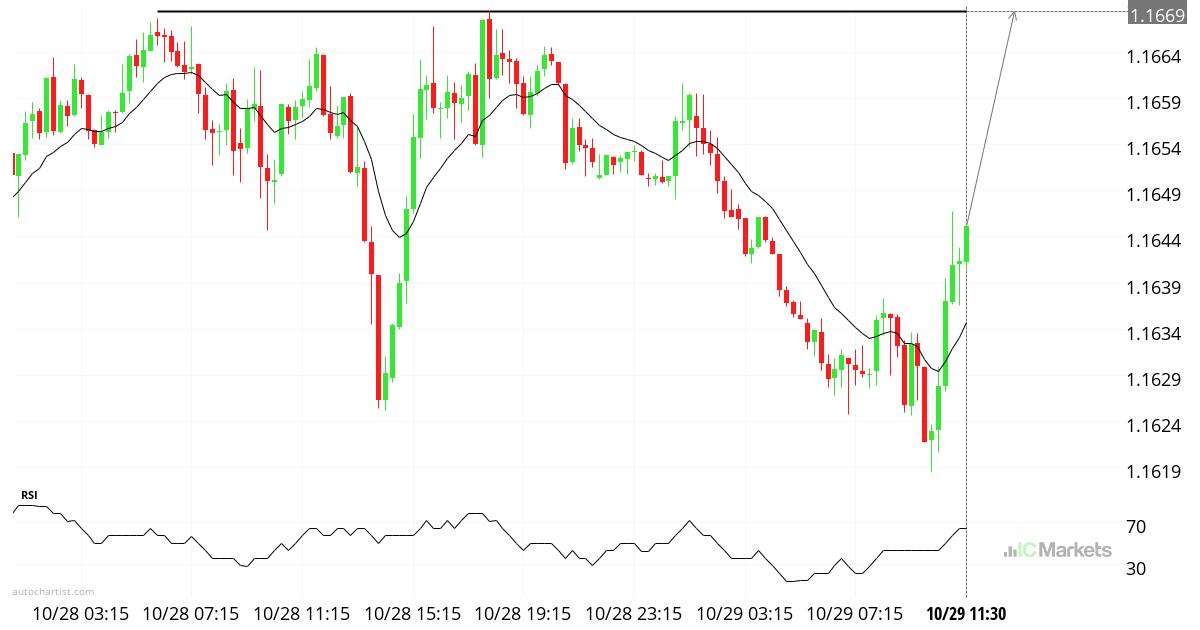
Euro vs US Dollar – KeyLevel – Resistance
Approaching Resistance level of 1.1669 identified at 10/29 11:30. This pattern is still in the process of forming. Possible bullish price movement towards the resistance 1.1669 within the next 7 hours. *** Spanish – Risk Warning: Trading in securities involves significant risk. Prices may fluctuate and securities may become valueless. Losses may exceed deposits. These […]
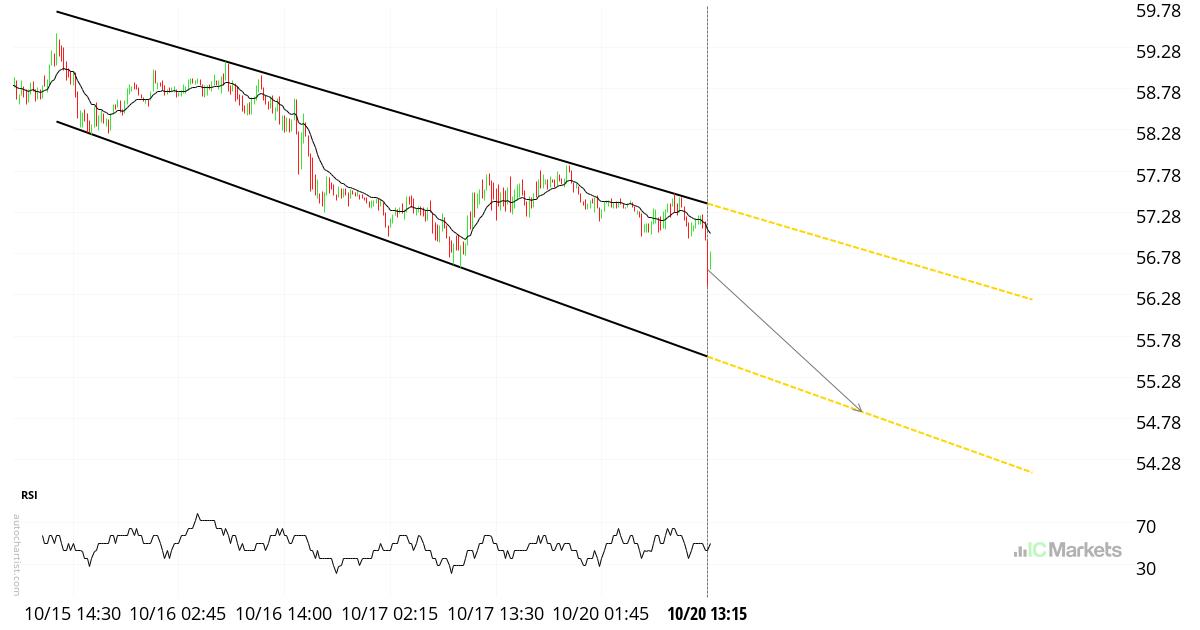
Crude Oil vs US Dollar – ChartPattern – Channel Down
Channel Down identified at 10/20 13:15. This pattern is still in the process of forming. Possible bearish price movement towards the support 54.86 within the next 21 hours. *** Risk Warning: Trading in securities involves significant risk. Prices may fluctuate and securities may become valueless. Losses may exceed deposits. These products are complex and require […]
Japan 225 Index – รูปแบบกราฟ – จั่วแบบลง
จั่วแบบลง ถูกระบุที่ 10/8 12:15 รูปแบบนี้กำลังอยู่ระหว่างกระบวนการสร้างตัว การเคลื่อนไหวของราคาแบบหมีไปยังแนวรับ 47,621.8750 ภายใน 5 ชั่วโมง ถัดไป การซื้อขายหลักทรัพย์มีความเสี่ยงสูง ราคาหลักทรัพย์อาจมีความผันผวนและอาจสูญเสียมูลค่าได้ นักลงทุนอาจสูญเสียเงินลงทุนเกินกว่าที่ฝากไว้ ผลิตภัณฑ์เหล่านี้มีความซับซ้อนและต้องใช้ความรู้ความเข้าใจอย่างเหมาะสมก่อนการลงทุน

Japan 225 Index – نموذج الرسم البياني – الوتد الهابط
تم تحديد الوتد الهابط في 10/8 12:15. لا يزال هذا النمط قيد التشكّل. توقعات بحركة سعرية هبوطية محتملة نحو مستوى الدعم 47,621.8750 خلال الـ 5 ساعات القادمة. تحذير من المخاطر: ينطوي التداول في الأوراق المالية على مخاطر كبيرة. قد تتقلب الأسعار وقد تفقد الأوراق المالية قيمتها بالكامل. قد تتجاوز الخسائر قيمة الودائع. هذه المنتجات معقدة […]
Japan 225 Index – ChartPattern – الوتد الهابط
تم تحديد الوتد الهابط في 10/8 12:15. لا يزال هذا النمط قيد التشكّل. توقعات بحركة سعرية هبوطية محتملة نحو مستوى الدعم 47,621.8750 خلال الـ 5 ساعات القادمة. تحذير من المخاطر: ينطوي التداول في الأوراق المالية على مخاطر كبيرة. قد تتقلب الأسعار وقد تفقد الأوراق المالية قيمتها بالكامل. قد تتجاوز الخسائر قيمة الودائع. هذه المنتجات معقدة […]
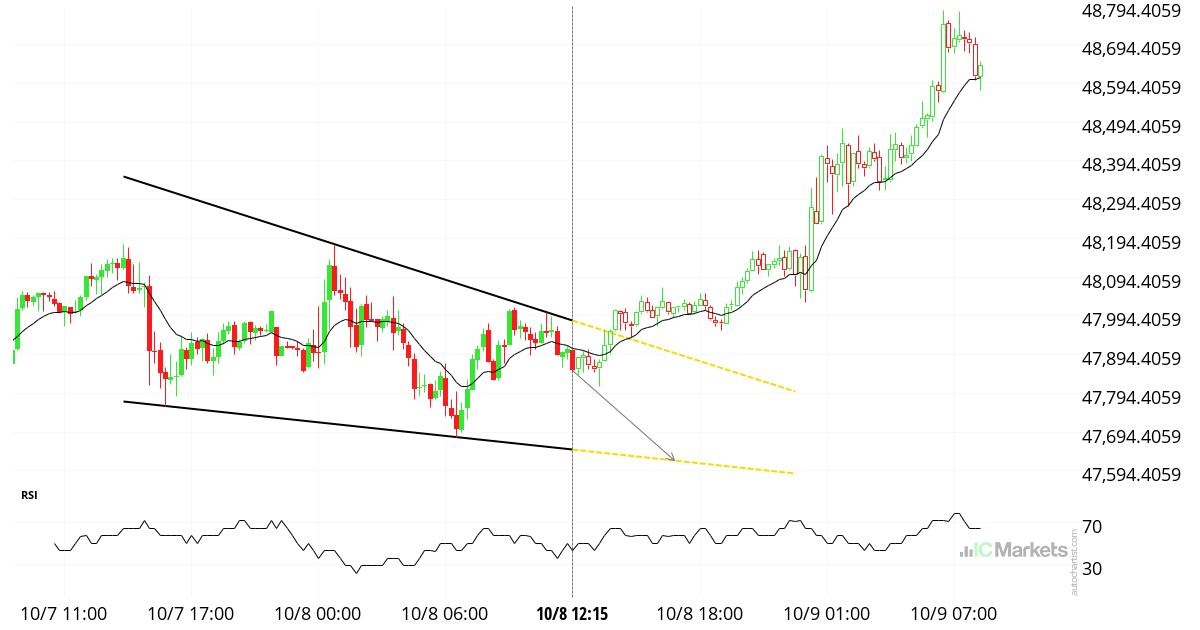
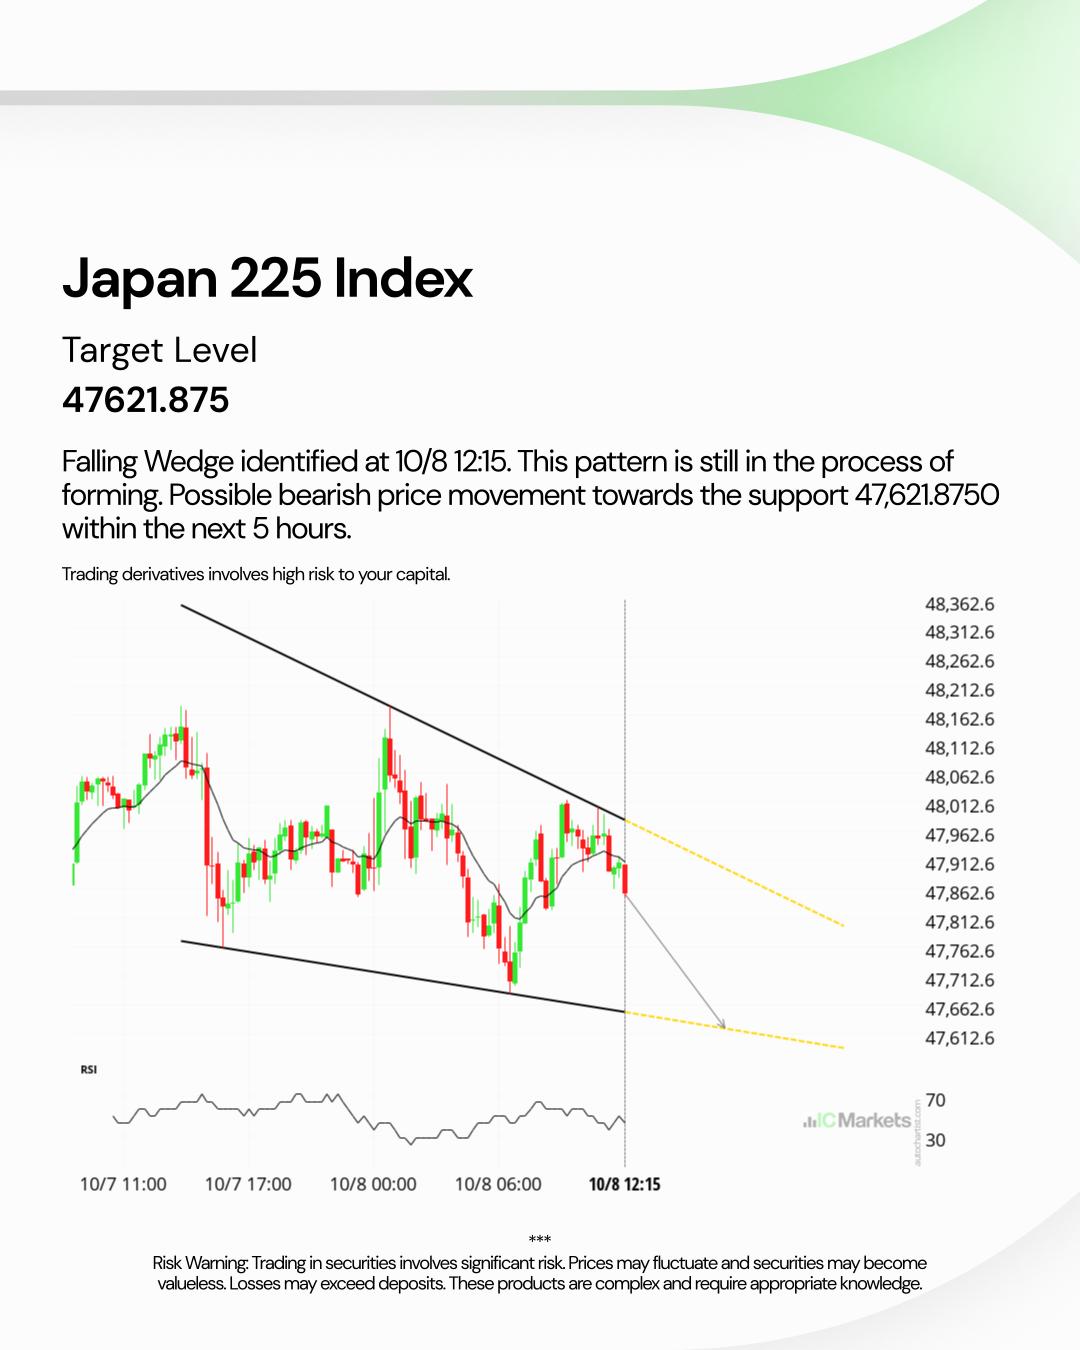
Japan 225 Index – ChartPattern – Falling Wedge
Falling Wedge identified at 10/8 12:15. This pattern is still in the process of forming. Possible bearish price movement towards the support 47,621.8750 within the next 5 hours. *** Risk Warning: Trading in securities involves significant risk. Prices may fluctuate and securities may become valueless. Losses may exceed deposits. These products are complex and require […]
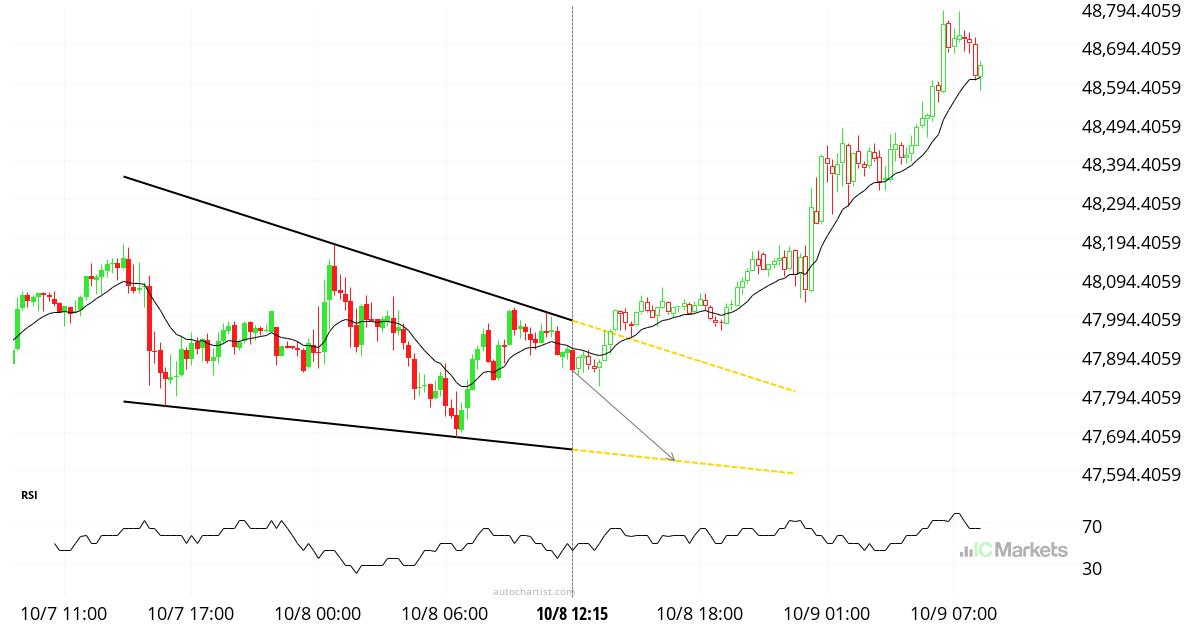
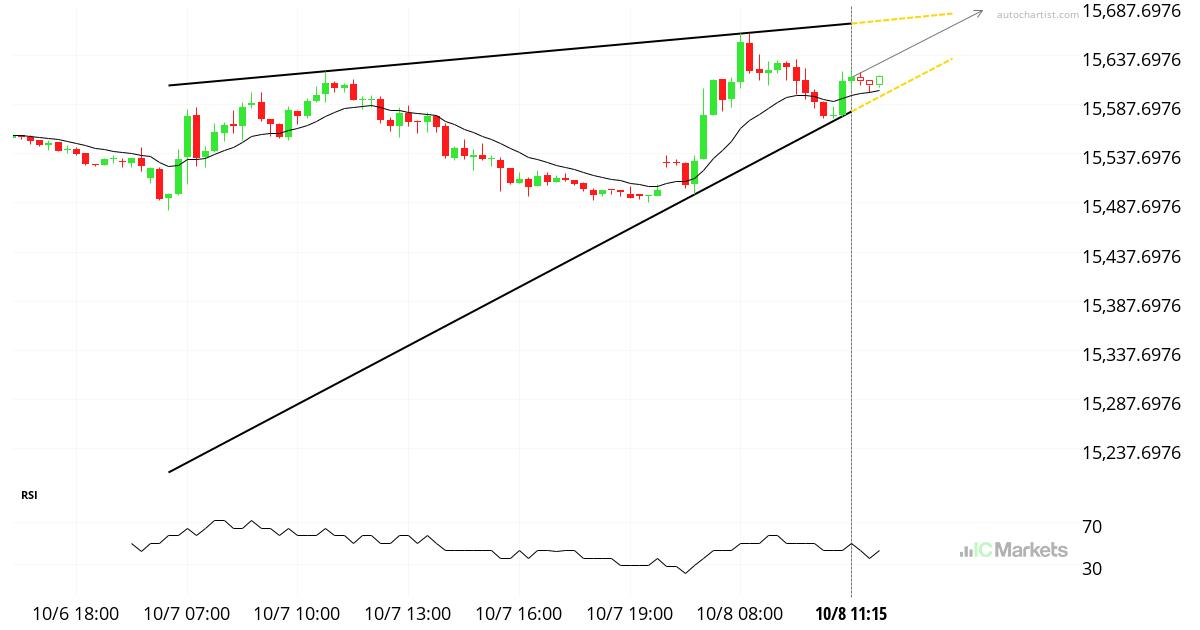
Spain 35 Index – ChartPattern – Rising Wedge
Rising Wedge identified at 10/8 11:15. This pattern is still in the process of forming. Possible bullish price movement towards the resistance 15,682.6167 within the next 3 hours. *** Risk Warning: Trading in securities involves significant risk. Prices may fluctuate and securities may become valueless. Losses may exceed deposits. These products are complex and require […]
FTSE China A50 Index – รูปแบบกราฟ – ช่องแบบลง
ช่องแบบลง ถูกระบุที่ 10/8 12:00 รูปแบบนี้กำลังอยู่ระหว่างกระบวนการสร้างตัว การเคลื่อนไหวของราคาแบบกระทิงที่อาจเกิดขึ้นได้ไปยังแนวต้าน 15,140.6350 ภายใน 1 วัน ถัดไป การซื้อขายหลักทรัพย์มีความเสี่ยงสูง ราคาหลักทรัพย์อาจมีความผันผวนและอาจสูญเสียมูลค่าได้ นักลงทุนอาจสูญเสียเงินลงทุนเกินกว่าที่ฝากไว้ ผลิตภัณฑ์เหล่านี้มีความซับซ้อนและต้องใช้ความรู้ความเข้าใจอย่างเหมาะสมก่อนการลงทุน

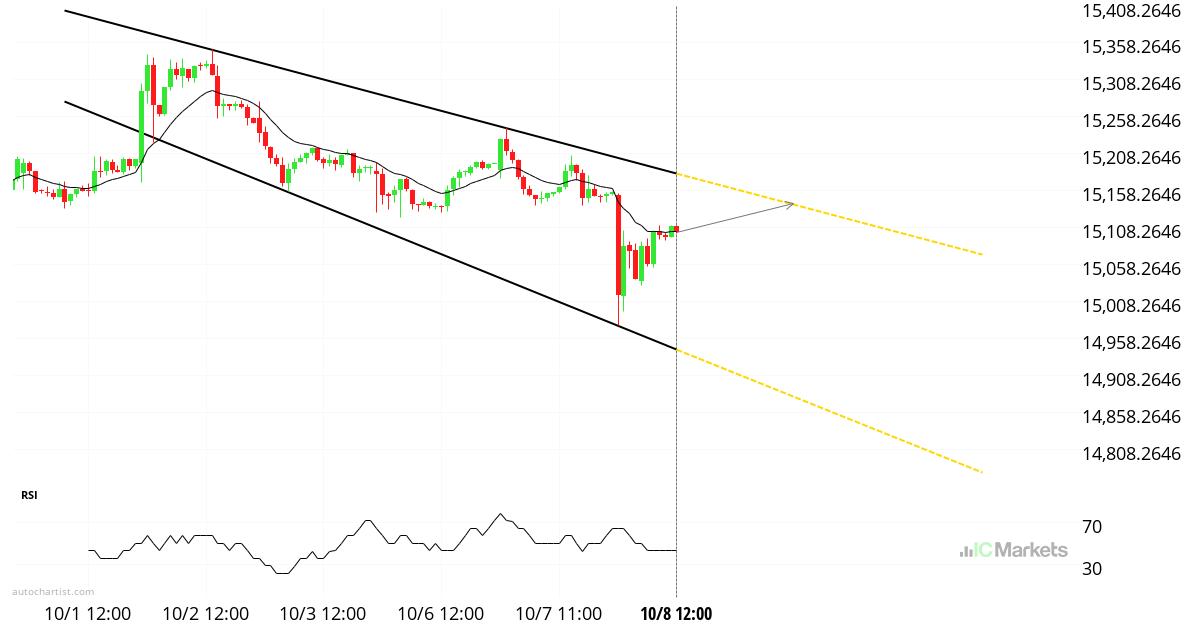
FTSE China A50 Index – نموذج الرسم البياني – القناة الهابطة
تم تحديد القناة الهابطة في 10/8 12:00. لا يزال هذا النمط قيد التشكّل. توقعات بحركة سعرية صعودية محتملة نحو مستوى المقاومة 15,140.6350 خلال الـ 1 يوم القادمة. تحذير من المخاطر: ينطوي التداول في الأوراق المالية على مخاطر كبيرة. قد تتقلب الأسعار وقد تفقد الأوراق المالية قيمتها بالكامل. قد تتجاوز الخسائر قيمة الودائع. هذه المنتجات معقدة […]